Cabaçal
Asset type:
Stage:
Product:
Location:
An advanced Gold-Copper project with district-scale potential
The Cabaçal Project represents the cornerstone of Meridian’s strategy to establish a scalable gold-copper platform in Brazil.
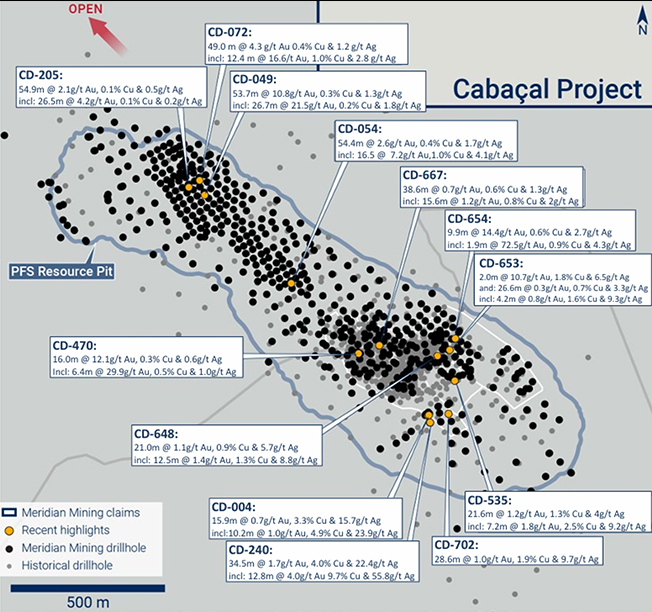
The Project is an advanced-stage copper-gold-silver volcanogenic massive sulphide (VMS) system located in Mato Grosso, Brazil. Defined by multiple thick, shallow-dipping mineralised zones, the deposit supports a conventional open-pit development approach and benefits from a strong existing resource base. Cabaçal is advancing as an standalone operation whilst continuing to explore the broader belt, positioning the project as both a near-term development opportunity and a platform for long-term growth.
The Definitive Feasibility Study (DFS) for the Cabaçal Project demonstrates the project’s strong economic potential and provides a clear pathway toward development. The study outlines an after-tax NPV of US$2.09 billion and an IRR of 108%, based on average annual production of 183,526 gold-equivalent ounces over an estimated mine life of 13.9 years. Total gold production is expected to reach 983,537 ounces, alongside 180,634 tonnes of copper and 1.78 million ounces of silver. Initial capital expenditure is estimated at US$322 million, with a projected payback period of 0.9 years, while All-in Sustaining Costs (AISC) are estimated at US$1,056 per gold-equivalent ounce. The DFS represents a significant milestone in the advancement of Cabaçal and supports the Company’s plans to progress the project toward development.
Following recent financing, key workstreams are accelerating, including the ordering of long-lead items and the advancement of pre-construction civil works. These initiatives position Cabaçal to move efficiently through the next stage of development and toward a potential construction decision.
Final Pit Shell

Click image to enlarge
Mine Site Layout

Click image to enlarge
Study
stage:
After-Tax
NPV (5%):
Internal Rate
of Return
Initial
CAPEX:
Payback Period: Approx.
Average Annual Production (years 1-5):
Base case
pricing:
Effective Date – December 31, 2025
| Classification | Weathering | Average Value | Material Content | |||||
|---|---|---|---|---|---|---|---|---|
| Mass (Mt) | Au (g/t) | Ag (g/t) | Cu (%) | Au (koz) | Ag (koz) | Cu (kt) | ||
| Measured | Saprolite | 0.33 | 0.44 | 0.69 | 0.12 | 4.56 | 7.22 | 0.38 |
| Transition | 1.83 | 0.55 | 0.63 | 0.21 | 32.60 | 37.25 | 3.81 | |
| Fresh Rock | 62.53 | 0.57 | 1.36 | 0.35 | 1,138.52 | 2,743.29 | 217.43 | |
| Total | 64.69 | 0.57 | 1.34 | 0.34 | 1,175.68 | 2,787.77 | 221.61 | |
| Indicated | Saprolite | 0.01 | 0.30 | 0.99 | 0.16 | 0.14 | 0.46 | 0.02 |
| Transition | 0.07 | 0.13 | 0.59 | 0.22 | 0.31 | 1.37 | 0.16 | |
| Fresh Rock | 5.32 | 0.49 | 1.00 | 0.22 | 83.09 | 170.77 | 11.69 | |
| Total | 5.41 | 0.48 | 0.99 | 0.22 | 83.54 | 172.59 | 11.87 | |
| Total | Saprolite | 0.34 | 0.43 | 0.70 | 0.12 | 4.70 | 7.68 | 0.40 |
| Transition | 1.90 | 0.54 | 0.63 | 0.21 | 32.91 | 38.62 | 3.96 | |
| Fresh Rock | 67.85 | 0.56 | 1.34 | 0.34 | 1,221.61 | 2,914.06 | 229.12 | |
| Total | 70.10 | 0.56 | 1.31 | 0.33 | 1,259.22 | 2,960.36 | 233.48 | |
Table 1: Cabaçal deposit mineral resource table.
The mineral resource for Cabaçal was classified and prepared in accordance with the Canadian Institute of Mining, Metallurgy and Petroleum (CIM) Definition Standards for Mineral Resources and Mineral Reserves, adopted by the CIM Council on May 10, 2014, as amended (the “CIM Standards”), and the CIM Estimation of Mineral Resources and Mineral Reserves Best Practice Guidelines, adopted by CIM Council on November 29, 2019, as amended (the “CIM Guidelines”) by Mr. Leonardo Moraes Soares, MAIG. Mr. Soares is an independent Qualified Person as such term is defined under NI 43-101. Mineral resource estimates defined within this 2025 MRE for Cabaçal will feed into the pending DFS, on track for filing in Q4 2026.
Notes related to the Mineral Resource Estimate (“MRE”):
-
- Measured and Indicated Resource estimate reported inside open pit constraints. Inferred category was not classified inside open pit constraints.
- The Mineral Resource Estimates were prepared in accordance with the CIM Standards, and the CIM Guidelines, using geostatistical and/or classical methods, plus economic and mining parameters appropriate to the deposit.
- Mineral Resources are not Mineral Reserves and are not demonstrably economically recoverable.
- Grades reported using dry density.
- The effective date of the MRE was December 31, 2025.
- The QP responsible for the Mineral Resources is geologist Leonardo Soares (MAIG #5180).
- The MRE numbers provided have been rounded to the estimate relative Values cannot be added due to rounding.
- The MRE is delimited by Mining tenement areas.
- The MRE was estimated using ordinary kriging in 5m x 5m x 5m blocks with sub-blocks of 2.5m x 1.25m x 0.625m.
- The MRE report table was produced in Leapfrog Edge software.
- The MRE was restricted by a pit shell defined using metal prices of USD 3,103/oz Au, USD 34/oz Ag, USD2 4.39/lb Cu, Mining cost of USD
9.11/t mined, processing cost of USD 7.82/t processed, metallurgical recovery calculated block by block based on metallurgical tests, G&A costs of USD 2.19/t processed, and USD 2.36/t processed logistics. - Equivalent Gold grade (“AuEq”) was calculated with the following general formula: AuEq = (Au_grade * %Au_Recovery) + (0.970*(Cu_grade
* %Cu_Recovery)) + (0.011*(Ag _grade * %Ag_Recovery)). - The QP is not aware of political, environmental, or other risks that could materially affect the potential development of the Mineral Resources other than those typical for mining projects at this stage of development.
- The resource cut-off grade applied for Measured and Indicated resources was 0.117 g/t AuEq.
- The underground mining void model has been used to deplete the resource.
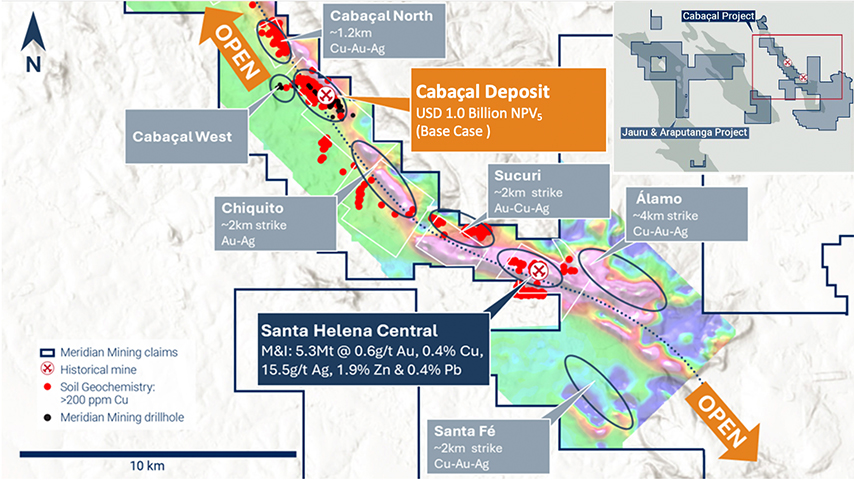
Beyond the core deposit, Cabaçal sits within a highly prospective ~50 km VMS belt under Meridian’s control. Ongoing exploration and a strong development strategy support the potential for resource expansion, mine life extension, and the development of a broader gold-copper district in the region.
Reserve statement – (Effective Date – December 31st, 2025)
| Classification | Average Value | Material Content | |||||
|---|---|---|---|---|---|---|---|
| Mass (t) | Au (g/t) | Ag (g/t) | Cu (%) | Au (koz) | Ag (koz) | Cu (kt) | |
| Proven | 54.91 | 0.62 | 1.33 | 0.35 | 1,096.3 | 2,351.5 | 423.7 |
| Probable | 1.13 | 0.28 | 1.00 | 0.25 | 10.2 | 36.3 | 6.23 |
| Proven & Probable | 56.04 | 0.61 | 1.33 | 0.35 | 1,106.5 | 2,388.0 | 429.9 |
Notes:
1.Mineral Reserves estimates were prepared in accordance with the CIM Standards (May 2014).
- Mineral Reserves represent the economically mineable portion of Measured and Indicated Mineral Resources.
- The estimate was prepared by Porfírio Cabaleiro, BSc (Mining Engineering), FAIG, FAusIMM, a Qualified Person as defined by NI 43-101
- The effective date of the Mineral Reserve estimate is December 31, 2025.
- The reference point is the delivery of ore to the primary crusher.
6. Mineral Reserves were estimated using GEOVIA Whittle software and were constrained within the PFS pit shell. - Geometric and economic first pass parameters include:
- Mining recovery: 97%
- Dilution: 3%
- Metal prices: USD 3,103/oz Au, USD 35.34/oz Ag, USD 4.39/lb Cu
- Mining cost: USD 2.95/t mined
- Processing cost: USD 7.82/t milled
- G&A: USD 2.19/t milled
- Logistics: USD 2.36/t milled
- Exchange rate: 1 USD = 5.60 BRL
- Metallurgical recoveries: 89.11% Cu, 78.49% Au, 47.13% Ag
- Strip ratio: 1.42